
Spreadsheets
Spreadsheets, such as Excel workbooks or Google sheets, follow the same accessibility recommendations as other types of documents. Here, find recommendations and practices to implement into your spreadsheet habits.
Body Text
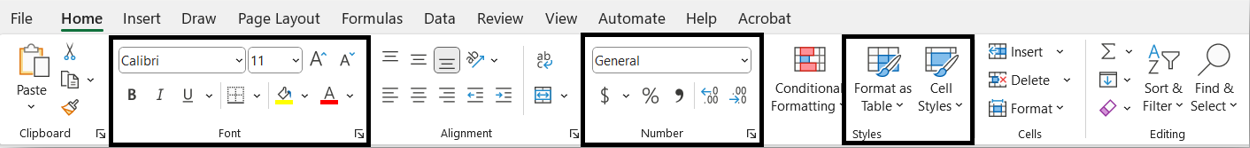
Any fonts should generally be sans-serif and a comfortable reading size. Fonts that are sans-serif do not have any flourishes or embellishments on the ends of letters, such as Calibri, Century Gothic, Trebuchet, or Helvetica. Use a font of 12pt or greater. Keep the font consistent throughout the content.
Learn more about writing accessible text.
Titles and headings
Unlike most word processing software, data processing software like Microsoft Excel doesn’t support the use of headings. Generally, accessibility is handled using font styling, cell formatting options, or tables with header rows.
Be sure to give each sheet tab a unique and clear title. These help readers move to meaningful information efficiently.

Hyperlinks
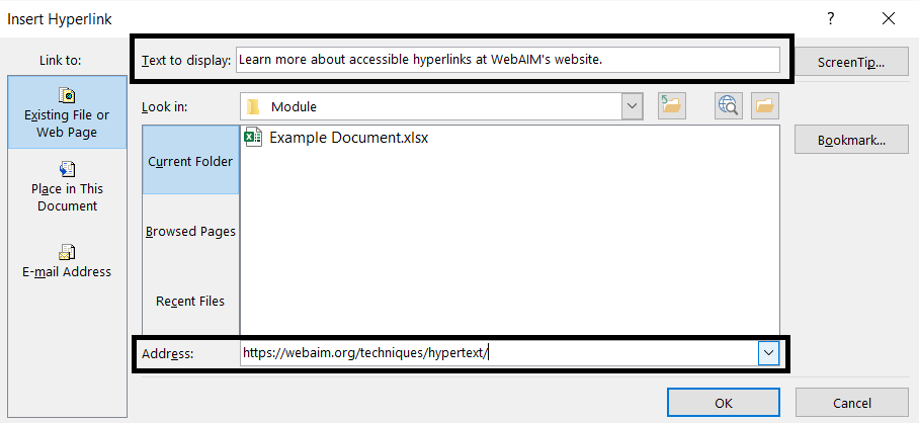
Accessible spreadsheets also use descriptive hyperlinks to help the reader understand where the link will direct them to. To add a hyperlink to a cell, you can usually:
- right click on the cell and choose Link or
- use the keyboard shortcut CTRL+K (Windows) or ⌘+K (Mac)
Learn more about creating accessible, embedded hyperlinks.
Colour Contrast
Some colours in charts may make the information hard to read. Check the colour contrast in a chart or spreadsheet before sharing, or choose chart styles that are more accessible to read. For example, in Microsoft Excel, there are a variety of Chart Styles to choose from.
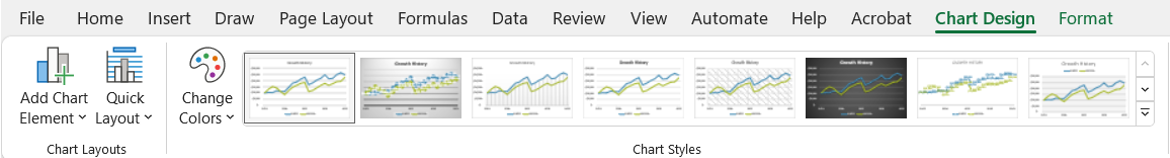
Generally, charts with higher contrast, thicker lines and larger or minimal text are easiest to read. Choose charts that might also use lines or data points.
Learn more about checking the colour contrast of your content.
Graphics
Non-text elements such as shapes, graphics, and charts will each need to have alt-text added to help make them readable. Like other software, you can easily find the alt text option by either
- right-clicking on the object, or
- using chart Format options.
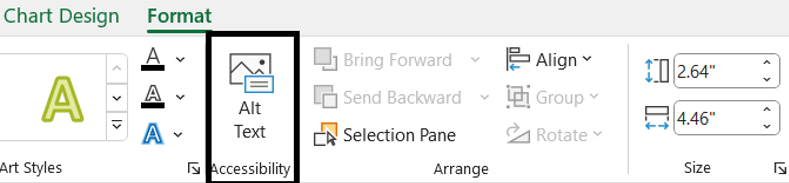
In the alt text pane, describe the chart or graphic. Avoid using “image of…” or “chart of…” at the beginning of the alt text. Summarize the overall takeaways from the data.
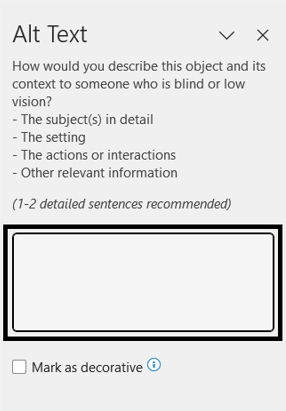
While alt text aims to be simple and concise, it may be challenging to consolidate the meaning of a chart or graphic. Instead, you could add text explanations of the chart to the cell the chart or graphic occupies.
Be cautious about using the Mark as decorative option. It should not be used if the reader would have to parse through a table to find the information provided by the chart or graphic.
Learn more about adding alt text to images and non-text content.
Building Cells and Tables
A simple table is far more accessible than a complex table. To build an accessible table,
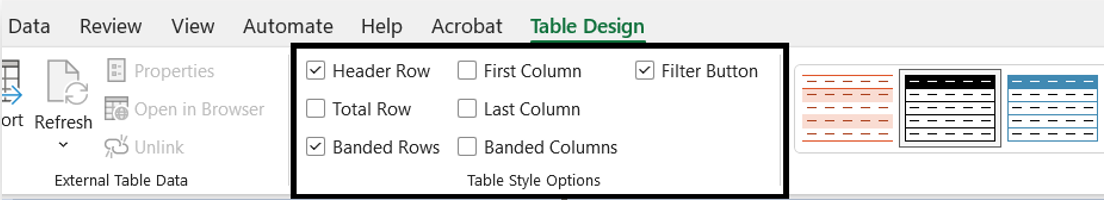
- Format tables with header rows to assist navigation and provide context.
- Consider using banded rows to help learners visually discern different data ranges.
- Avoid merging or splitting cells.
Following are some additional recommendations about how to best create a spreadsheet that is readable by all. You may not be able to apply all these recommendations but might consider these to be general best practices.
- Hide unused cells, rows, and columns to reduce clutter and help focus on important information.
- Screen readers start reading at Cell A1. Avoid leaving this cell empty to prevent confusion. Insert tables, graphics, or charts starting from the first column, and consider adding helpful explanatory text in cell A1.
- Avoid leaving rows and columns empty. Delete unnecessary blank rows and columns, or resize them for readability. If using them for spacing, consider adding text like “No data” or “Intentionally Blank” in a colour that blends with the background.
Learn more about creating accessible tables.
Document Properties
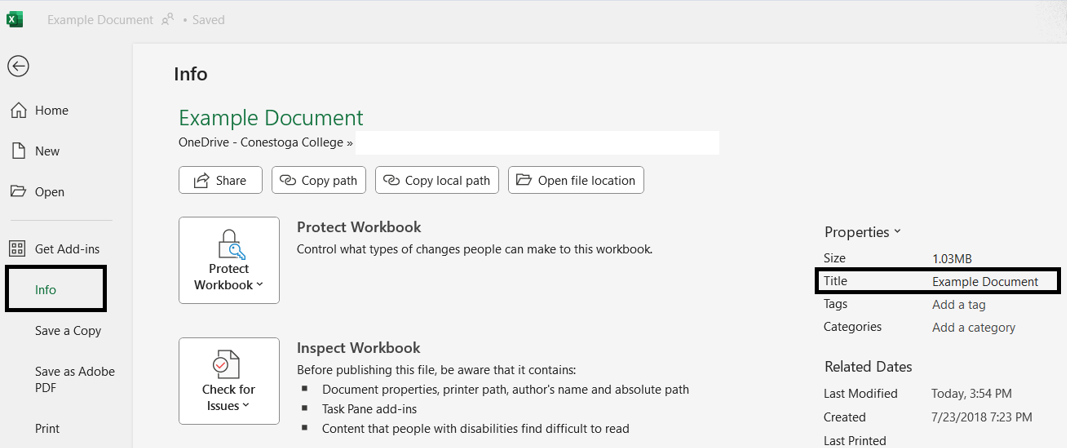
Add a descriptive title in the document properties. Separate from the document’s name, this works as part of the document’s metadata. It allows screen reader users to preview information without opening the document. Consider also adding relevant Tags if the document will be searchable by search engines.
Use simple and clear filenames, and avoid using versions in naming conventions. In cloud-based document storage such as SharePoint, OneDrive or Google Drive, a document contains all historical versions in its version history. Learn more about version histories in Microsoft documents.
Accessibility Checker
As your final step, use the software’s built-in accessibility checker. Resolve any Errors or Warnings by following the prompts the checker gives you.

Learn more about how to use the accessibility checker in Microsoft Excel.