Visual thinking activities achieve different types of learning objectives, and they enhance the learning process as well. This teaching tip gets you thinking about how to use visuals for learning in any mode of delivery.
Visual Thinking for Learning
David Sibbett, author of Visual Meetings (2010), explains that visual activities move learners through a cycle of learning that “begins in the imagination with intention and task focus, moves through exploration and engagement, then thinking and pattern finding, and finally decisions to move to application” (Sibbett, 2010, p.11).
In other words, visual activities can have a holistic impact on learners because they connect seeing with thinking, feeling, and doing.
Learning outcomes establish and clarify the goals of the activities (Vanderbilt University, Center for Teaching, 2020). They can plan and delivery appropriate instruction, and ensure that student evidence reflects learning in those goals.
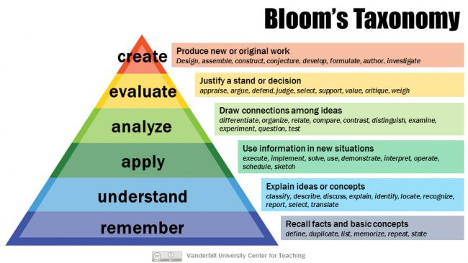
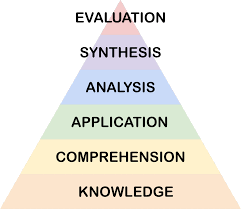
Activities for learning promote different cognitive processes, including imagining problems, exploring patterns, organizing solutions, and sharing ideas. These processes are described and differentiated using Bloom’s Taxonomy (Figure 1).
Visual learning activities can develop thinking skills at every cognitive domain level.
Ideas for Visual Thinking Activities
Below is an overview of 6 visual thinking activities. The first 3 (Mind maps, Flow charts, and Fishbone/Ishikawa diagrams) provide visual ways to organized text. The second 3 (Supported drawing, Storyboard, and Digital collage/posters) visualize with images and text ideas, concepts, and processes.
Descriptions include what thinking skills these activities build and as how to facilitate them with some or no technology for your real time or anytime classes. Click the (+) button for each section to learn more.
Mind Maps
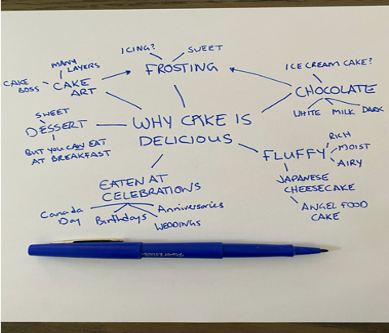
A mind map/concept map/cluster diagram is a visual representation of knowledge, a way to visually organize information such as tasks, words, concepts, or items that are arranged around a central idea.
Thinking skills include: Recalling information and explaining ideas or concepts
Use for: Content review, pre-assessments, and energizing students
Activity idea: Students compare mind maps before and after a lesson, or create individually and compare in groups
Low-Tech delivery: Students create on a piece of paper, then take a picture and email or upload to a discussion forum
Some Tech delivery: Use a web-based mind mapping tool or a whiteboard and a stylus
Mind map example. By Elan Paulson CC0
Flow Chart
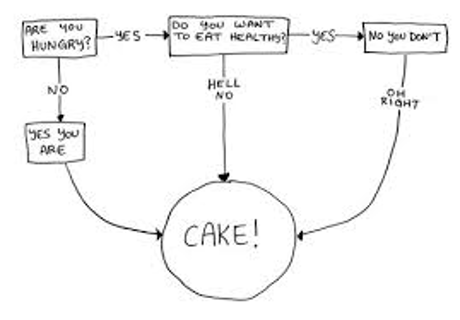
A flow chart is a type of diagram that represents a workflow or process, a step-by-step approach to solving a task.
Thinking skills include: Explaining ideas and applying information to operationalize decisions and implement action (a useful industry tool)
Activity: Ask students to prepare a flow chart for any aspect of your course, including how to submit assignments, etc.
No tech: Have students create using a piece of paper
Some tech: Create and share digital flow charts created in PowerPoint, Zoom Whiteboard, or MS Whiteboards
A fishbone (ishikawa) diagram is a cause-and-effect diagram, in which the problem is listed as its head and the causes and issues (or sub-issues) are feed into its spine.
Thinking skills include: Analyzing and drawing connections and making distinctions between ideas and properties to solve problems
Activity idea: Good for root cause analysis and diagnostic activities
No tech: Have students create using a piece of paper
Fishbone diagram describing microscope malfunction By DanielPenfield CC BY-SA 3.0
Supported Drawing
A supported drawing is a visual assembled by the student selecting and placing pre-made objects onto a provided background (Clark & Mayer, 2016).
Thinking skills include: Understanding information by describing, identifying, and locating relevant components
Use to: Help students to review information, retrieve and recall information, understand cycles, systems, and processes
Low tech: Create a fill-in-the blank that students print and complete
Some Tech: Create a partially created drawing using a Whiteboard or PowerPoint
Supported drawing example. By Elan Paulson CC0
Storyboard
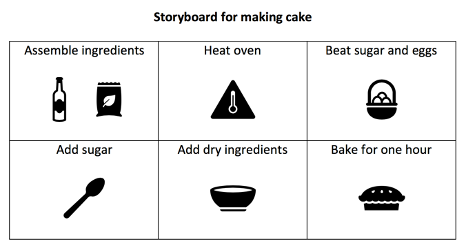
A storyboard is a graphic organizer that plans a narrative. It visually presents information visually in a linear direction using cells.
Thinking skills include: Creating a new work by assembling, constructing, and developing a visual timeline, and demonstrating understanding of a procedure or process
Use to: Map out/design project steps or presentation order
Some tech: Create a storyboard template using MS Word Doc.
Digital Collage or Poster
An image collage is a piece of art created by combining photos, clippings, and images onto a surface, sometimes in a particular design.
Thinking skills include: Investigating, assembling, and designing
Activity idea: Collage or poster created in breakout groups during synchronous meeting using PPT or Canva; Share all posters after class to eConestoga forum gallery
Low-tech: Students share ideas and create a collage or poster on PowerPoint
Some-tech: Share in an eConestoga forum gallery
References
Clark, R. C., & Mayer, R. E. (2011). E-learning and the science of instruction: Proven guidelines for consumers and designers of multimedia learning. San Francisco, CA: Pfeiffer.
Sibbet, D. (2010). Visual meetings: How graphics, sticky notes, & idea mapping can transform group productivity. Hoboken, N.J: John Wiley & Sons.
Van Meter, P, & Garner, J. (2005). The promise and practice of learner-generated drawing: Literature review and synthesis. Educational Psychology Review 17(4). DOI: 10.1007/s10648-005-8136-3. Available at ResearchGate https://www.researchgate.net/publication/227301771
Vanderbilt University Centre for Teaching (2020). Bloom’s Taxonomy.
Elan Paulson
Elan Paulson, PhD, has been an educator in Ontario's higher education system since 2004. Before joining Conestoga as a Teaching and Learning Consultant, Elan was on the executive team at eCampusOntario. She previously served as Program Director and as an instructor in professional education programs at Western University's Faculty of Education. With a Master's in Educational Technology, Elan specializes in technology-enabled and collaborative learning to support diverse learners. She has also conducted research on faculty participation in communities of practice for professional learning and self-care.