Ways to Use Visuals in Teaching
This teaching tip shares different ways to integrate visuals easily into teaching. All examples are generously provided and reproduced with permission by faculty member David Sitler, who teaches in the Quality Assurance program.
Attractive and visually dramatic imagery can do more than gain students’ attention in teaching and learning. Visuals can help learners to introduce new information, provide examples, support understanding, aid recall, and reinforce important reminders (Burmark, 2002).
General Tips for Making and Using Course Visuals
Here are some of the suggestions from faculty David Sitler to those who want to start or enhance how they use visuals in their course materials.
- Think about how you might visualize a lesson with graphics and/or photos related to a subject you teach.
- Attend a Teaching & Learning workshop or course on basic visuals and terminology.
- Research possible Creative Commons photo databases, such as Unsplash.
- Get excited about the visuals you are adding for your students including the added value to their course enjoyment.
- Learn about how to make your visuals accessible to all students.
- Think of your use of visuals in your teaching as a continuous improvement (Kaizan) approach. Allow time for your idea to develop by creating beta version A, beta version B, of the visuals that you use, changing and improving them based on student feedback etc.
David created his visuals using selected images from the Unsplash Creative Commons photography database. For each visual, David included attribution information, and wrote detailed alternative text (“alt text”) to support learners with visual impairments.
Ways to Use Visuals
See the sections below for brief descriptions, and examples from Dave’s course materials, on different ways to use visuals for course materials.
Presentation Title Slide
Visuals can be used as a title image in PowerPoint or other presentation slide for students during synchronous meetings.

Figure 1 shows a subject title for scatter plot graphing module. The lava illustrates the interaction between lava (x on the scatter plot graph) and ocean water (y on the scatter plot graph). The title also begins a discussion about what is a critical value and how it must be displayed on all scatter plots.
Concept Visualization
An image can be a visual representation or reminder of a particular concept or idea covered in class content.

Figure 3 is an image that appears within Dave’s course materials. The mug has an 80 over 20 on its face, representing the 80/20 rule. The title of the image, “Pareto Analysis: Understanding the 20 emphasizes the focus of the lesson on the critical value of 20 in pareto analysis.
Concept or Process Example

An image can provide a title, visual representation or demonstration, and reminder of a concept, process, or procedure.
Figure 4 is an image of a water drop hitting more water. The water graphic illustrates two related concepts, cause (falling water droplets) and effect (waves in the water). The second line in the title, “Why Six Attributes,” provides an introduction to a type of diagram that is used in cause and effect analysis.
Visualizing Thinking Steps
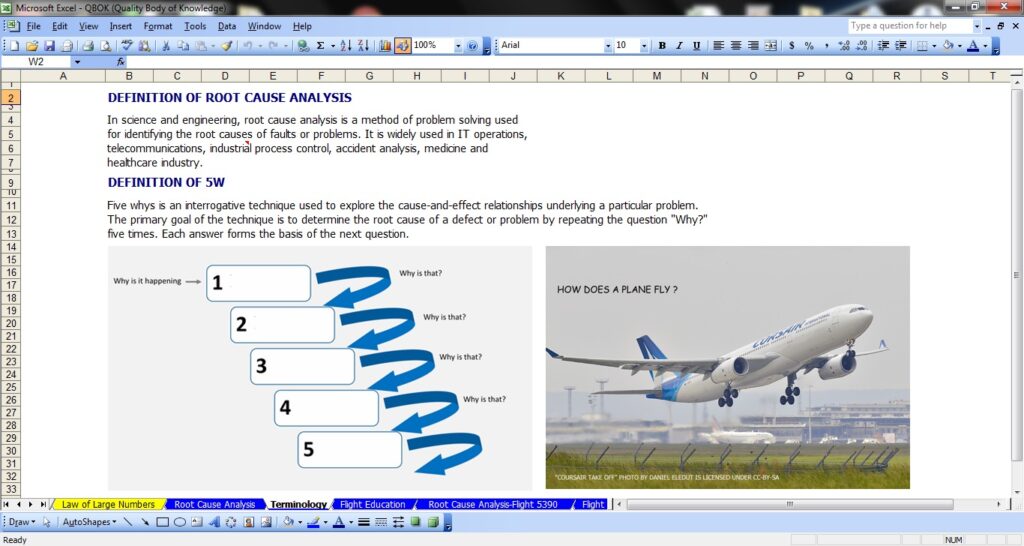
Visuals can provide an alternative means of describing or representing steps in a thinking process. By using visuals, faculty can help students to understand a process with visuals that break down the steps.

Figure 5 is a screenshot of a Microsoft Excel workbook page that defines and gives an example of root cause analysis. Root cause analysis proceeds with the 5 Why’s Process (5W), an interrogative technique that explores cause and effect relationships. In this screenshot, the 5W thinking process and an example for practice (“How does a plane fly?”) are visualized.
Course Reminders
Visuals can be used as gentle reminders of course review or exam dates, as well as other important course information.

In Figure 6, the visual explains that the final exam review is on August 13 at 3:00 pm. Shared in an eConestoga Announcement or email message, the visual also helps students to “focus on success” for this final assessment.
For more information on creating and using visuals, see related posts on Finding Images and Visual Thinking Activities for Learning.
References
Burmark, L. (2002). Visual literacy: Learn to see, see to learn. Alexandria, Va: Association for Supervision and Curriculum Development.


